
Introduction: Why is GRT Worth Your Technical Research and Time?
In the cryptocurrency market, the upward logic of many tokens is straightforward: exchange tokens track platform revenue, public chain coins depend on ecosystem TVL, meme coins feed on community sentiment, and AI coins surf on narrative hype. However, GRT is distinct. The Graph behind it operates fundamentally as the "data infrastructure" of the Web3 world.
If we conceptualize blockchain as an open, public database, a structural bottleneck arises: although on-chain data is transparent, it is inherently difficult to read, organize, and query efficiently. If a developer wants to track a DeFi user’s historical transactions, changes in an NFT contract holder, voting metrics of a DAO, or volume trends of a DEX, they cannot simply skim an on-chain block explorer. Raw blockchain data is notoriously complex. If developers had to build their own nodes, parse raw smart contract events, maintain databases, and design custom APIs independently, they would incur massive operational costs.
This is precisely the pain point The Graph solves. Through Subgraphs and GraphQL, it enables developers to index and query blockchain data seamlessly. The protocol's official description is direct: it is an indexing protocol for organizing blockchain data and making it easily accessible with GraphQL.
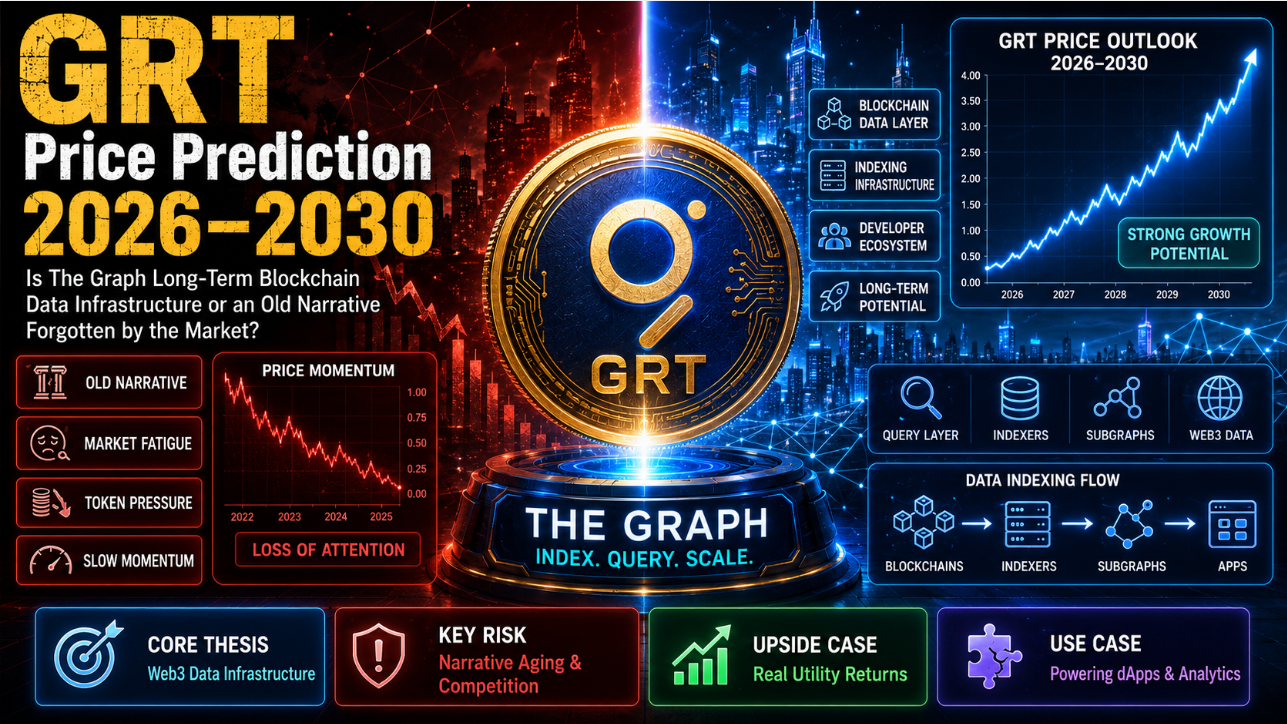
Therefore, the foundational difference between GRT and traditional DeFi governance tokens is clear: it is not a speculative bet on a single trading product, but an investment in the structural data querying demands of the Web3 application layer. If Web3 dApps, AI Agents, DeFi protocols, RWA platforms, on-chain identity systems, and GameFi networks continue to expand, the demand for on-chain data indexing and querying will scale concurrently. Conversely, if Web3 remains confined to a niche circle, the growth ceiling for The Graph will be heavily constrained.
Many refer to The Graph as the "Google of Blockchain." This analogy holds weight because it actively helps developers locate and retrieve on-chain data faster. However, this comparison should not be overextended. Google targets everyday internet consumers, whereas The Graph primarily services developers, protocols, data dApps, and institutional clients. It functions as the indexing layer + query layer + data marketplace of the Web3 data architecture, rather than a simple user-facing search box.
By May 2026, the price of GRT has been fluctuating around $0.03. CoinMarketCap data shows a circulating supply of approximately 10.8 billion GRT, putting its market capitalization in the $300 million tier. This valuation sits far below its 2021 bull market peak, indicating that the market is not currently granting it a high growth premium.
This introduces a critical question: Is GRT a heavily undervalued piece of Web3 data infrastructure, or has it devolved into an outdated, legacy narrative? This article breaks down a complete evaluative framework spanning The Graph’s protocol mechanics, tokenomics structure, historical price action, cyclical projections for 2026–2030, underlying risk signals, and retail investment strategies.
Chapter 1: Demystifying the GRT Network to Predict the Token's Valuation Bounds
1.1 What Precise Pain Point Does The Graph Solve?
The Graph was not engineered to solve a token-issuance problem; it was built to solve the core issue of how blockchain data can be utilized with maximum efficiency.
Before data indexing protocols like The Graph existed, developers building an on-chain application had to run local nodes, sync continuous blocks, parse complex smart contract events, manually write data to custom databases, and then design custom query interfaces for their product's front-end. This process is incredibly resource-heavy, commanding high up-front development and ongoing maintenance overhead. For bootstrap startup teams, expending massive engineering energy on low-level data extraction significantly slows down product iteration.
The Graph’s value proposition is centered right here: it allows developers to build Subgraphs—which are custom data indexing blueprints tailored to specific smart contracts or execution scenarios. Once deployed, applications can seamlessly query this pre-sorted, structured data using GraphQL. The protocol's official interfaces emphasize that The Graph frees developers from running data servers, building custom indexing systems, or parsing raw data, allowing them to ship applications faster.
Put simply, if networks like Ethereum, Arbitrum, Polygon, and Avalanche function as the "raw data generators," The Graph operates as the crucial intermediate layer that refines, structures, and converts that data into an easily queryable, composable resource.
This is the primary layer of GRT’s long-term value thesis: as long as Web3 applications scale up and on-chain data grows increasingly complex, developer reliance on reliable indexing and querying services will remain persistent.
1.2 Breaking Down Key Network Roles: Indexer, Curator, and Delegator
The Graph does not function as a centralized, single-point API service; it operates as a decentralized data marketplace sustained by multiple coordinated economic roles.
                  ┌───────────────────────────────┐
                  │          DEVELOPERS           │
                  │ (Pay Query Fees via GraphQL)  │
                  └───────────────┬───────────────┘
                                  │
                                  ▼
┌──────────────────┐      ┌───────────────┐      ┌──────────────────┐
│     CURATORS     │      │   INDEXERS    │      │    DELEGATORS    │
│ (Signal Quality  │─────►│ (Stake GRT &  │◄─────│ (Delegate Capital│
│   via Subgraphs) │      │ Index Data)   │      │ to Earn Rewards) │
└──────────────────┘      └───────────────┘      └──────────────────┘
- Indexers: These are node operators who stake GRT tokens and run physical node infrastructure to provide data indexing and query processing services to the network. Official documentation explicitly notes that Indexers stake GRT to deliver indexing and query handling, earning query fees and inflationary indexing rewards for their service.
- Curators: These are subgraph architects or data experts who locate high-quality Subgraphs and back them with GRT tokens to signal their viability. In short, Curators tell the marketplace which Subgraphs are well-constructed and most likely to see active query traffic from developers. Official The Graph terminology glossaries state that Curators identify premium Subgraphs and earn a share of subsequent fees via this signaling mechanism.
- Delegators: These are everyday token holders who choose not to operate physical nodes themselves but instead allocate their GRT capital to existing Indexers. By doing so, they actively secure the network and secure a percentage of the protocol rewards. Official manuals confirm that Delegators can delegate GRT to Indexers to secure a portion of index rewards and query fees.
Consequently, the GRT tokenomics framework goes beyond a simple "buy and hold" passive asset. It functions as an active economic coordination tool where Indexers supply physical computing power, Curators identify data quality, Delegators supply essential security capital, and developers or consumer dApps pay direct query fees.
If this economic loop executes efficiently, GRT captures massive value as a data network resource. If real-world query demand remains deficient, GRT risks functioning primarily as an asset sustained by inflationary issuance.
1.3 Where Does Genuine GRT Consumption Occur?
The utility and economic sinks of the GRT token are anchored directly to query fees, staking requirements, rewards distribution, and slashing parameters.
First, developers or data consumers pulling information from The Graph network must pay direct Query Fees denominated or settled via GRT. Over a multi-year horizon, this is the definitive value capture mechanism for the asset. Only when the aggregate volume of query fees scales large enough can the network successfully transition away from an inflation-subsidized model toward a completely self-sustaining, usage-paid network economy.
Second, Indexers are mandated to stake a substantial amount of GRT to offer data services. If an Indexer delivers malicious data, errors, or fails uptime metrics, they face strict economic Slashing. This mechanism aligns the Indexer's financial incentives with network reliability.
Third, the act of delegation introduces a structural token sink. The Graph's official terminology outlines that when Delegators allocate GRT to an Indexer, they trigger a 0.5% Delegation Tax, which is programmatically burned and permanently removed from circulation.
Fourth, signaling activities performed by Curators feature built-in fees and burning mechanics. The Graph's core tokenomics documentation notes that multiple programmatic burn mechanisms exist within the network—including the delegation tax, curator signaling fees, and a percentage of standard query fees—all designed to structurally offset new token emissions.
This proves that GRT possesses real programmatic consumption mechanics. The ultimate testing ground remains whether real query fees and network adoption metrics can expand fast enough to outpace structural inflation and market distribution pressure.
1.4 Evaluating the Tokenomics Model and Circulating Realities
GRT originally launched with an initial supply metric of 10 billion tokens, a benchmark widely tracked by legacy investors. Concurrently, The Graph’s economic model incorporates inflationary rewards designed to incentivize Indexers to scale up their node operations. Early third-party data tracking and community forums frequently cited an annual token issuance rate of roughly 3%, while official tokenomics documentation emphasizes that the network relies on its programmatic burn mechanisms to actively counter this new issuance.
By May 2026, CoinMarketCap data confirms that the circulating supply of GRT has surpassed 10.8 billion tokens. This dictates that modern investors can no longer analyze the token based on the outdated "10 billion initial supply" data. Instead, analysis must focus on the dynamic balance between current circulating supply, future staking rewards, the percentage of tokens locked in network nodes, burn velocity, and real-world cash-settled query fees.
The key to evaluating GRT tokenomics is analyzing what that inflation actively buys for the network. If inflationary emissions successfully procure a more resilient Indexer web, superior data api quality, expanding query volumes, and deep developer retention, then inflation functions as an investment in network growth. If inflation simply prints new tokens for participants while organic revenue and query volume remain flat, it acts as a permanent weight on price.
1.5 Why Competitors Haven't Displaced The Graph
The Graph operates at the intersection of two primary competitive vectors.
The first vector is centralized data infrastructure providers, such as Alchemy, Moralis, QuickNode, and Covalent. Their competitive advantages are centered on highly polished user experiences, instant plug-and-play onboarding, and extreme service uptime stability. Many developer teams do not actively care whether their underlying data layer is decentralized; they prioritize reliable APIs, predictable subscription costs, and granular data precision.
The second vector consists of newer, specialized decentralized data protocols emerging alongside the growth of advanced AI architectures, RWAs, DePIN, and cross-chain execution models.
Despite these competing forces, The Graph preserves its market dominance due to its established brand equity among developers, the universal standardization of the Subgraph model, a massive decentralized network participant base, and deep multi-chain ecosystem integrations. Crucially, The Graph is not just an API product; it has successfully engineered an open, functioning marketplace for data indexation, query distribution, economic incentives, and distributed governance.
However, a market moat is never permanent. If The Graph restricts its vision solely to traditional Subgraph indexing rules, it risks being marginalized by faster, cheaper, and more agile database services. To protect its valuation ceiling, it must aggressively execute its roadmap to transform into a multi-service data layer, a foundational data engine for autonomous AI Agents, and an enterprise-grade data infrastructure hub.
Chapter 2: Six Core Variables Shaping GRT’s Price Trajectory
2.1 The Bitcoin Liquidity Cycle Remains the Dominant Variable
Regardless of The Graph's fundamental strength, GRT cannot escape the macro digital asset liquidity cycle. When Bitcoin moves into an expansion phase, capital trends sequentially: first into BTC and ETH, then cascading into dominant Layer 1 networks like SOL, BNB, and AVAX, before finally rotating into mid-and-small-cap infrastructure protocols. Because GRT operates as a pure data infrastructure asset, its breakout velocity typically lags behind pure retail-driven narrative coins. However, once a full-scale altcoin rotation establishes itself, GRT historically demonstrates substantial high-beta elasticity.
Analyzing GRT requires evaluating where global crypto liquidity stands within the post-halving expansion curve. If BTC preserves its structural uptrend, and major public chains trigger active rotational volume amid expanding market risk appetites, GRT can be efficiently re-priced by the market. If BTC breaks down into a macro markdown cycle, individual protocol developments will fail to prevent long-term price deterioration.
2.2 Query Volume functions as the Definitive Fundamental Metric
If an investor must isolate a single operational metric to audit the long-term health of the protocol, it must be Query Volume.
The Graph's monetization architecture is highly transparent: developers, applications, or data analytics platforms query data -> network node participants process the indexing and service execution -> GRT serves as the programmatic utility resource driving fees, rewards, and governance. Scaling query volumes indicate increasing real-world integration of The Graph into the global app ecosystem; decaying query volumes indicate the protocol is failing to move past an abstract concept.
However, query volumes and day-to-day token prices do not move in perfect lockstep. In the short term, GRT’s price action is dictated by speculative market emotion, macro exchange volumes, derivatives positioning, and technical chart setups. Over medium-to-long-term horizons, if organic query volumes trend upwards while the price remains compressed, the market will eventually clear the valuation gap; if price pumps aggressively while query data points remain flat, it serves as a stark warning sign of pure speculation.
2.3 Subgraph Expansion Signifies Ecosystem Depth, but Quality Matters Over Quantity
Another primary health metric for the network is the aggregate volume of deployed Subgraphs. Higher Subgraph creation signals that a wider pool of applications and protocols are actively formatting their contract data into structured, easily queryable parameters.
However, investors must distinguish between absolute deployment numbers and active utility. A Subgraph deployed to the network that registers zero query volume provides negligible economic value capture for the GRT token. The ideal fundamental framework requires simultaneous expansions across multiple metrics: rising Subgraph deployments -> increasing active query interactions -> expanding aggregate query fees -> rising Indexer revenue -> expanding structural demand to purchase and stake GRT.
2.4 Managing the Realities of Inflationary Emissions
The built-in inflation mechanism of GRT is not a structural flaw, as it serves the vital purpose of funding Indexers and securing network consensus. However, if organic market query demand is insufficient to absorb these new emissions, the programmatic rewards function as persistent selling pressure on the secondary market.
During a booming bull market, inflationary distribution pressure is easily ignored because speculative buying volume and narrative hype are more than enough to absorb the new supply. During a prolonged bear market, this equation flips. If Indexers, Delegators, or early backers are forced to liquidate their distributed GRT rewards to cover real-world operational hardware costs while organic query fee revenue fails to offset the supply, the token price will face ongoing downward pressure.
2.5 The Competitive Matrix Shapes the Valuation Ceiling
The biggest competitive threat to The Graph is not necessarily a direct clone of its decentralized indexing network. The real threat stems from any technical solution that can solve on-chain data retrieval problems at a lower cost and higher efficiency.
If centralized infrastructure providers can deliver data APIs that are significantly cheaper, more stable, and easier for traditional web developers to integrate, many dApp engineering teams will opt for convenience over decentralization. Conversely, if institutional players, autonomous AI Agents, compliance-focused DeFi protocols, and decentralized financial networks place an absolute premium on cryptographic data transparency, censorship resistance, verifiability, and open data access, The Graph’s core architectural advantages are heavily amplified. The long-term valuation ceiling of GRT is tied to a single structural question: Will the global Web3 data market gravitate toward centralized SaaS models or open-protocol architectures?
2.6 Institutional Capital Flows Dictate Near-Term Elasticity
The Graph historically captured significant venture capital and institutional mindshare during its foundational funding rounds. While this provided exceptional early-stage capitalization, it requires modern market participants to track institutional unlock profiles, venture capital staking concentrations, exchange liquidity depth, and whale wallet movements.
Near-term token performance is often dictated by order book dynamics and liquidity depth rather than immediate protocol valuations. When fresh capital flows into the asset class, order book depth improves, and trading volumes expand, GRT can execute rapid upward extensions. Conversely, if systemic liquidity thins out, or distribution volume from early lockups increases amid drying trading interest, the token price can languish in prolonged accumulation slumps. Fundamentals define the asset's structural justification; capital flows dictate the timing and velocity of its moves.
Chapter 3: Historical Price Review: Can the Explosive Price Action Replay?
The historical price chart of GRT serves as a textbook example of a high-utility infrastructure token: debuting into an exuberant bull market to print rapid upward extensions, entering a severe cyclical markdown to compress its valuation multiples, and subsequently grinding through technical development milestones while its secondary market price remains detached from past historical peaks.
Price ($)
  ▲
2.88  │      ▲ (Feb 2021 Macro Peak - Driven by Peak Hype)
      │     ╱ ╲
      │    ╱   ╲
      │   ╱     ╲
      │  ╱       ╲
0.03  │ ╱         ╲_____________________. (2022-2026 Post-Migration / Horizon Accumulation Range)
      └───────────────────────────────────► Time
In December 2020, GRT debuted on secondary spot exchanges. The market rapidly consolidated around the token, positioning it as the definitive infrastructure representative of the Web3 data layer. By February 2021, GRT executed a massive vertical run to its all-time high of approximately $2.88. That opening rally was fueled by a mixture of fundamental optimism, abundant macro bull market liquidity, and an enormous valuation premium assigned to the brand-new narratives of "Web3 Middleware" and "Blockchain Indexing Layers."
However, subsequent market cycles proved that GRT’s 2021 pricing had aggressively front-ran its immediate operational fundamentals. While the market was enthusiastic about buying long-dated future assumptions, The Graph’s real-world query fee revenues, decentralized mainnet migration milestones, subgraph economic structures, and direct token value capture mechanisms were still in their infancy. Consequently, when the macro bear market arrived, GRT suffered a significantly deeper markdown relative to core large-caps like BTC and ETH.
This highlights the unique risk profile embedded within mid-cap infrastructure assets: they sound far more fundamentally justified than pure meme tokens, but during systemic market panics, capital aggressively flees high-valuation, long-duration assets in favor of immediate capital preservation assets.
Between 2023 and 2025, GRT did not execute the explosive, high-velocity trend reversals captured by specialized AI networks, localized meme tokens, or fast-growing ecosystems like Solana. While this does not imply that The Graph protocol has failed operationally, it reveals that the broader market liquidity has simply not rotated back into the "Web3 Data Infrastructure" sector. Infrastructure projects can make substantial technical progress while their token prices remain suppressed if the market calculates that the token's value capture is too indirect or its revenue scaling velocity is moving slower than competing narratives.
An essential turning point arrived in 2024 when The Graph successfully executed the final phases of migrating its legacy, free hosted services directly onto its decentralized network architecture. Research reports from entities like Messari note that the Sunrise phase concluded in June 2024, officially retiring the free hosted service endpoints and driving a sustained, structural expansion in the volume of active deployed subgraphs operating directly on the decentralized mainnet.
This milestone is incredibly important for the GRT token economy. Historically, a major bottleneck for the protocol was that a vast army of Web3 developers utilized the free hosted service layer, meaning this substantial operational traffic failed to generate direct query fees or value capture within the decentralized protocol economy. With the migration fully concluded, The Graph is structurally positioned to route real-world application query volume directly into its programmatic economic model.
The takeaway from its historical cycles is clear: GRT’s next major macro market trend will not be a simple copy-paste of the 2021 run. In 2021, the market bought raw, unvetted imagination; over the 2026–2030 horizon, the market will strictly demand hard data—verifiable query volumes, cash-settled fees, developer retention metrics, decentralized AI data layer positioning, and tangible token value capture.
Chapter 4: GRT Price Prediction — 2026
The year 2026 serves as a major re-pricing window for the GRT token. This is driven not only by the trailing liquidity expansion of the Bitcoin halving cycle but by the fact that The Graph is actively evolving its core identity from a single-service Subgraph protocol into an all-encompassing, modular data infrastructure layer.
The Graph’s technical roadmap highlights that its operational goals center heavily on scaling protocol modularity, core data services, and macro economic adjustments, built directly upon the foundation of the Horizon upgrade. Core developer publications note that the Horizon framework is engineered to transition The Graph into processing diverse, complex blockchain data services well beyond traditional Subgraph constraints.
The Horizon upgrade represents the most vital structural fundamental variable for the GRT token economy. Landmark updates confirm that the Horizon mainnet architecture is designed to transform The Graph into a modular ecosystem capable of servicing multiple data demands simultaneously.
[Legacy The Graph Architecture] ──► Limited to Traditional Subgraph Queries
                                           │
                                           ▼ (Horizon Mainnet Upgrade)
[Modular Data Infrastructure]   ──► Multi-Service Data Platform (SQL, Key-Value, Streams, AI Datasets)
This marks a complete expansion of The Graph’s narrative: it is moving past the story of "developers using Subgraphs to query basic contract events" and entering the narrative of "developers, autonomous AI Agents, data scientists, institutional systems, and advanced DeFi engines utilizing The Graph as a comprehensive, multi-service data layer." If this transition achieves commercial traction, the underlying valuation multiples assigned to GRT will expand significantly beyond legacy historical boundaries.
2026 Price Targets
- Bearish Range ($0.02 – $0.06): In this scenario, GRT remains pinned within a depressed accumulation bracket. If Bitcoin experiences macro weakness, altcoin liquidity thins out across the board, and the Horizon mainnet rollout fails to translate into immediate query volume expansion, GRT will likely continue its horizontal chop, potentially testing or breaking major psychological support floors as network emissions continue to distribute.
- Base-Case Range ($0.08 – $0.25): This target assumes a moderate, steady recovery across the aggregate crypto landscape. Under this bracket, The Graph logs consistent, linear growth in organic query volumes and on-chain validator activity, while the market begins pricing in its utility as a decentralized data layer for AI models—initiating a healthy valuation mean-reversion away from multi-year lows.
- Bullish Range ($0.50 – $1.20): Hitting this upper target requires multiple conditions to align perfectly: BTC and ETH preserve a powerful structural bull trend, capital cascades deeply into infrastructure networks, the Horizon upgrade triggers an immediate wave of developer data adoption, and the market successfully re-defines The Graph as the definitive data layer for on-chain AI configurations—sparking a major expansion in spot trading volume and network staking locks.
The vital buy signals to track in 2026 are not erratic, single-day exchange pumps, but the simultaneous alignment of health metrics: accelerating monthly query charts, a stable count of active Indexer nodes, improving quality metrics across deployed subgraphs, an upward trend in the GRT staking ratio, and clear data showing capital rotating out of dominant layer-1 networks into foundational infrastructure assets.
Chapter 5: GRT Price Prediction — 2027
The core analytical problem defining 2027 is a simple one: If GRT executes a major structural breakout during the 2026 cycle, can it successfully defend those valuation levels?
Infrastructure assets frequently undergo major re-evaluation runs during market expansions, but they are equally prone to aggressive valuation compression during late-stage market cycles. This occurs because allocators inevitably transition from trading loose narrative assumptions to demanding hard metrics: What is your net protocol revenue? How many enterprise-grade enterprise clients are actively burning tokens to query data? Why is this token structurally required to sustain this network? If a protocol cannot supply transparent answers to these parameters, its price action will violently mean-revert.
2027 Price Targets
- Cyclical Markdown Scenario ($0.04 – $0.12): If the aggregate market enters a macro correction or transitions into a full-scale bear market in 2027, GRT will likely retrace back into the $0.04–$0.12 liquidity band. While the underlying technology remains fundamentally sound, a macro contraction in global risk appetites will drive investors to liquidate high-beta infrastructure positions in favor of capital preservation, causing a sharp contraction in GRT valuation multiples.
- Consolidation / Sideways Scenario ($0.12 – $0.35): Under a baseline market consolidation framework, GRT is projected to navigate a trading range between $0.12 and $0.35. The protocol continues to execute its operational goals, and developers remain deeply embedded within the ecosystem, but net query fee growth moves linearly rather than exponentially, and the AI data layer narrative remains long-dated. This range can trigger frustration for long-term holders, as the underlying project functions perfectly while the token price remains range-bound.
- Extended Bullish Growth Scenario ($0.60 – $1.80): For GRT to attack or sustain the $0.60–$1.80 range, the broader market must continue to assign high valuation premiums to Web3 data rails, complemented by explosive growth across The Graph’s modular Horizon network, autonomous AI Agent data retrievals, and cross-chain indexation services. If the foundation proves that it successfully services fields beyond traditional DeFi—expanding directly into enterprise big data, compliant RWAs, and machine learning analytics—the market will aggressively expand its long-term valuation premium.
For participants who accumulated positions during the low-range 2026 windows, your primary priority in 2027 should be executing systematic profit-taking brackets based on data metrics. If price growth is backed by exploding organic query fees, deep network staking, and linear developer retention, maintaining a core position is fundamentally logical. If the pump is primarily driven by near-term exchange sentiment and speculative derivatives momentum, scaling down exposure is the rational play. GRT does not possess the structural store-of-value premium of Bitcoin; managing cyclical volatility via disciplined profit execution is vital.
Chapter 6: GRT Price Prediction — 2028
The year 2028 will likely function as a decisive consolidation year for the GRT token economy. During this phase of the market cycle, allocators will refuse to pay premium valuations for the vague marketing phrase "Web3 Infrastructure." Capital will evaluate hard, un-audited metrics: How many active developer teams are paying fees to the network? What is the structural growth rate of the query volume charts? Is the Indexer node network expanding or contracting? Are machine learning systems actively utilizing the network for on-chain state verification? Does the aggregate fee generation comfortably support the tokenomic framework?
Because The Graph possesses a lengthy operational history, an entrenched developer base, and universal protocol recognition, its systemic risk of winding down completely is dramatically lower than newer, unvetted micro-cap protocols. However, avoiding absolute failure does not guarantee outperforming the market. The digital asset space features numerous legacy projects that remain operationally functional for years while their token prices permanently underperform core large-caps and newer, agile infrastructure networks.
2028 Price Targets
- Pessimistic Capitulation Scenario ($0.05 and below): If the market enters a prolonged capitulation phase, GRT risks slipping below the $0.05 threshold. This scenario plays out if developer migration shifts structurally back toward centralized data delivery services, query fee growth flatlines on mainnet, competing protocols completely monopolize the AI data layer narrative, and GRT staking rewards fail to attract or retain long-term capital allocators amid drying trading volumes.
- Standard Bear Market Consolidation ($0.05 – $0.15): In a standard cyclical bear market environment, GRT is projected to build a macro valuation floor between $0.05 and $0.15. The network remains structurally healthy, node operators maintain validation, and core github repositories update continuously, but the market strips away all growth premiums. For long-term investors, navigating this phase requires intense discipline, as it becomes incredibly difficult to separate a generational accumulation bottom from a multi-year value trap.
- Healthy Accumulation Bottom ($0.15 – $0.40): Under a healthier market scenario, GRT preserves a baseline range between $0.15 and $0.40. While explosive upward runs are absent, the decentralized ecosystem runs smoothly, modular Horizon data services achieve steady institutional adoptions, and autonomous AI systems begin generating a reliable, baseline flow of query fee revenues—building the foundational infrastructure required to fuel the next macro liquidity cycle.
- Early Cyclical Recovery ($0.50+): If an early cyclical market recovery triggers ahead of schedule, GRT has a clear technical path to reclaim the territory above $0.50. This requires forward-looking capital pools to begin aggressively front-running the projected 2029 macro liquidity halving cycle, complemented by The Graph firmly preserving its tier-one position within the decentralized data indexing sector.
The absolute key to evaluating GRT in 2028 is auditing its anti-fragility. Query volumes that grow or hold flat during a severe market markdown represent real, organic demand. Developers who continue building on the protocol during a cyclical winter represent a sticky developer ecosystem. Fee revenues generated during market drawdowns confirm an indispensable web utility.
Chapter 7: Long-Term Outlook — GRT Price Prediction 2029–2030
Between 2029 and 2030, the GRT token economy will face its ultimate macro challenge: Can The Graph generate enough economic velocity to structurally challenge and surpass its 2021 historical peak?
The historical ATH for GRT sits at approximately $2.88. Re-testing or breaking through this resistance zone cannot be accomplished via simple, short-term altcoin rotation hype. It demands that global capital pools fundamentally conclude that The Graph is not just a legacy piece of Web3 infrastructure, but a vital infrastructure protocol powering the next-generation AI + Web3 Data Architecture.
[2030 Valuation Ceiling Scenarios]
  ├── Extreme Macro Bull ($3.00 - $5.00+): Core Protocol for AI Data Rails / Global Monopolization
  ├── Base-Case Target   ($0.50 - $1.50):  Stable Web3 Utility / Moderate AI Revenue / Standard Multi-Chain Use
  └── Stagnant Drop      ($0.03 - $0.15):  Marginalized by SaaS / Token Dilution / Dissipated Mindshare
By 2030, if the absolute volume of Web3 developers scales exponentially, on-chain dApp ecosystems proliferate, and across-the-board implementations of RWAs, DeFi primitives, GameFi worlds, and decentralized social networks require continuous, sub-second queries of blockchain states, The Graph's valuation ceiling will rise significantly.
Crucially, if autonomous AI Agents become the dominant economic actors on public blockchains, they will require real-time access to wallet configurations, transaction histories, smart contract variables, governance parameters, asset distributions, and historical network event data. If The Graph successfully establishes itself as the primary, decentralized data interface engine for these machine learning entities, its structural narrative will be significantly more powerful than the speculative framework of 2021.
However, this narrative carries distinct execution risks. Autonomous AI systems are not forced to route their data requests through The Graph. They can choose to fetch on-chain states via centralized high-speed API clusters, custom localized databases, direct node service connections, or brand-new data-streaming protocols. The Graph's capacity to capture the macro AI structural trend depends on whether its decentralized marketplace can process data faster, cheaper, and with higher composability than alternative structures, while successfully translating network usage directly into economic value for the GRT token.
2029–2030 Long-Term Price Projections
- Marginalized / Stagnant Scenario ($0.03 – $0.15): If The Graph is structurally outpaced or marginalized by centralized SaaS alternatives by 2030, GRT will likely settle into a permanent low-range bracket between $0.03 and $0.15. The network will continue to process minor traffic, but the market will permanently strip away its infrastructure valuation premium.
- Base-Case Framework ($0.50 – $1.50): Under standard, realistic market parameters, GRT is projected to fluctuate within the $0.50–$1.50 range. This implies that The Graph successfully preserves its position as a primary piece of Web3 data infrastructure, logging consistent linear growth in query volume and modular service rollouts, though it falls short of achieving an absolute monopoly over the AI data architecture layer.
- Optimistic Market Expansion ($2.00 – $3.00): This target opens the door for a re-test of the $2.00 to $3.00 zone, nearing its past historical peaks. This valuation models a powerful macro bull cycle accompanied by significant structural expansions in protocol revenue, accelerating global query volumes, wide multi-chain institutional indexing adoptions, and a tokenomic model that effectively burns supply to reward long-term capital allocators.
- Extreme Macro Bull Scenario ($3.00 – $5.00+): Achieving the upper bound between $3.00 and $5.00+ requires The Graph to establish itself as an indispensable core protocol powering global on-chain AI data rails. Under this framework, the market completely validates its token value capture mechanisms, proving that rising real-world usage translates into systematic, programmatically enforced buying pressure and token supply contraction for GRT.
When measured against premier large-caps like BTC, ETH, and SOL, GRT’s risk-adjusted return profile represents a distinct vertical infrastructure bet rather than a diversified asset play. BTC serves as the premier decentralized reserve asset of the digital economy, ETH operates as the foundational global smart contract and settlement layer, and SOL commands a dominant position as a high-performance consumer-grade execution network. GRT is a concentrated bet on the data indexation layer. If your thesis proves correct, it can deliver high elasticity; if the execution fails, it risks underperforming mainstream large-caps over a multi-year horizon.
To contextualize this vertical data infrastructure thesis against alternative public infrastructure assets, comparing it directly against an AVAX Price Prediction 2026–2030 provides immense analytical perspective. While Avalanche structures its economic value around scalable public chain ecosystems, custom institutional subnets, and multi-chain validation architecture, The Graph concentrates its token utility entirely within data retrieval, indexation markets, and query API delivery. Both are vital components of the macro infrastructure narrative, yet their underlying pathways to value capture are fundamentally distinct.
Chapter 8: Practical Portfolio Action Plan for Retail Investors
Long-dated market price forecasting is an exercise in probability mapping rather than identifying rigid absolute figures. The value of a comprehensive forecast is building a disciplined execution model to navigate multiple market environments without emotional bias.
- Investor Profile Alignment: GRT is optimized for disciplined, fundamental-focused investors who possess the capacity to track on-chain data trends, evaluate developer infrastructure metrics, and absorb long-duration token volatility. If your core objective is low-drawdown capital preservation, your primary capital must remain anchored within BTC and ETH. If you have high conviction in the future growth of Web3 data markets, machine learning infrastructure, and decentralized middle-layer dApps, GRT functions as a volatile satellite position.
- Position Sizing Parameter Controls: For the average retail allocator, GRT should be tightly restricted within your satellite portfolio tranche—historically capped between 5% to 10% of your total digital asset allocation. Conservative investors can choose to maintain a pure observation stance, moderate allocators can deploy minor capital to treat it as a broad infrastructure index play, and aggressive traders should implement strict profit-taking target brackets rather than market-entering with a single unhedged position.
- Execution Methodology: Given GRT’s high volatility profile and lower liquidity tier relative to mega-cap large-caps, entering the asset class via a single, unhedged market buy exposes you to severe near-term drawdown risks. A more calculated strategy involves establishing a minor tracker position during historical accumulation slumps, and only scaling up your allocation once hard network data points—such as organic query charts, protocol fee generation, active Indexer nodes, and token burn rates—confirm a structural upward trend.
On-Chain Health Metrics Tracking Manual
To monitor the structural health of the protocol, consistently track these five primary metrics via open data analytical platforms:
- Mainnet Query Volume Charts: The absolute north-star metric. It confirms whether the decentralized network is actively processing real-world web traffic.
- Protocol Fee Generation & Burn Velocity: Tracks the precise financial cash flows entering the protocol economy and confirms whether the burn mechanisms are effectively counteracting token emissions.
- Active Indexer Node Concentration: Monitors the physical network security and stability of the data delivery layer.
- Active Subgraph Interactions: Verifies whether deployed Subgraphs are delivering tangible commercial data utility or sitting idle as dead code.
- Net Developer Activity & Horizon Adaptations: Audits github repository velocity, developer documentation engagement, and the commercial adoption of modular data extensions.
Red Flag Monitoring List
Immediately re-evaluate your long-term investment thesis and position sizing parameters if any of the following technical red flags occur:
- [ ] Net mainnet query volume enters a prolonged, structural downward trend over a 6-month window.
- [ ] Developer teams migrate away from Subgraphs to adopt centralized API infrastructure alternatives.
- [ ] Net economic revenue generated by Indexers degrades to a point where node operators shut down infrastructure.
- [ ] Whale wallets or venture capital lockups execute sustained, high-volume token transfers into exchange spot books.
- [ ] Programmatic token inflation completely overwhelms network query fee burn rates without a stabilization path.
- [ ] The structural mindshare of the AI data layer narrative is completely captured and locked down by competing data protocols.
If your personal risk appetite favors extreme community-driven momentum, viral retail attention networks, and high short-term emotional elasticity over complex database infrastructure code, comparing this analysis against a SHIB Price Prediction 2026–2030 offers a perfect tactical contrast. While Shiba Inu's valuation waves are heavily driven by community attention networks, retail meme distribution, and localized ecosystem expansions, GRT’s price trajectory is tied to developer retention curves, query volume metrics, cash-settled network revenues, and physical infrastructure adoptions. Both profiles occupy the high-risk spectrum, yet their underlying drivers of risk are completely decoupled.
Conclusion: GRT functions as a Long-Dated Option on Web3 Infrastructure Value
Allocating capital into the GRT token economy represents a concentrated bet that three distinct structural conditions will align over a multi-year horizon:
- Global Web3 application deployments will scale exponentially, generating an unprecedented volume of complex on-chain data querying demands.
- The Graph successfully preserves its market monopoly as the premier decentralized indexing layer and data routing engine across the multi-chain ecosystem.
- The underlying GRT token mechanics effectively capture the physical value of that network scaling via robust query fee collection and programmatic supply burning, rather than functioning merely as an inflationary incentive unit.
- If you calculate a high probability that these three conditions will prove true, GRT represents a powerful asset to maintain on your structural accumulation and tracking sheets.
- If your analysis indicates that Web3 data markets will expand but will ultimately be captured by centralized SaaS providers, the justification for holding GRT breaks down.
- If the underlying technology functions flawlessly but the tokenomics fail to programmatically enforce direct value capture from query volume, protocol growth will fail to translate into secondary market price appreciation.
The Bottom Line: GRT should never be treated as an asset for blind, unhedged over-allocation. It operates fundamentally as an "infrastructure option" on the Web3 data layer. If global dApp ecosystems and autonomous AI Agent rails transition into hyper-commercial mass-adoption phases, The Graph is uniquely positioned to be re-priced aggressively by global capital pools. If that macro inflection window faces multi-year delays, GRT will continue to grind through horizontal accumulation ranges to digest its token emissions. Focus on the raw signals: track query volume charts, verify net protocol fee generation, audit developer retention metrics, and align your position sizing with strict risk management discipline.
FAQ: Frequently Asked Questions Regarding GRT (2026–2030)
What precise utility does the GRT token provide?
GRT functions as the native cryptographic utility and coordination asset powering The Graph network. It is structurally required to facilitate data indexing, process GraphQL query distributions, secure node validations via staking, execute capital delegation, signal subgraph quality via curation, and distribute programmatic network incentives. The asset's long-term value is directly tied to the global volume of on-chain data query demands.
Is The Graph truly the "Google of Blockchain"?
While the analogy is helpful for general conceptualization—as both index massive data pools to make information instantly searchable—it is technically incomplete. Google is built as a centralized search engine optimized for direct consumer web exploration. The Graph operates as a decentralized indexing layer and query engine engineered explicitly for application developers, smart contract protocols, data analytics dApps, and institutional automated workflows. It is a middle-layer infrastructure platform rather than a consumer search bar.
Does GRT possess a realistic path to execute a major bull run in 2026?
The structural path exists, but it remains dependent on the convergence of macro liquidity cycles and protocol milestones. If Bitcoin sustains a macro bull trend, capital flows directly down into core infrastructure assets, and the rollout of the modular Horizon upgrade triggers immediate expansions in query volumes and AI data narrative adoptions, GRT possesses the technical parameters to execute a strong trend reversal. However, a sustainable rally requires hard on-chain data confirmation; short-term momentum lacking fee-generation growth will struggle to hold structural support.
Can GRT successfully break its historical all-time high by 2030?
This scenario functions as an optimistic market ceiling rather than a default base-case expectation. For GRT to eclipse its past peak of $2.88, The Graph must achieve dominant commercial adoption as the primary data indexing engine for multi-chain dApp networks, establish its infrastructure as a vital data routing layer for autonomous AI Agents, and demonstrate a tokenomic framework where query fee burns completely neutralize token emissions to drive structural supply contraction.
What represents the most critical structural risk vector threatening GRT?
The primary risk to GRT is the reality of "network utility decoupling from token price performance." In this scenario, The Graph could remain widely integrated across the developer ecosystem as a helpful technical tool, but weak native value capture mechanics or low aggregate query fees fail to generate enough burn velocity to offset token emissions—causing the price to languish despite technical milestones. Additionally, competition from high-speed centralized SaaS providers or the failure of the AI data narrative to convert into active revenue present ongoing structural headwinds.
Is GRT a suitable asset for an average retail market participant?
GRT is optimized for market allocators who understand decentralized database infrastructure, can rigorously track on-chain network health metrics, and possess the psychological capacity to weather prolonged altcoin markdown phases. It is unsuited as a core foundational allocation for market beginners, and should never be accessed using financial leverage or debt. The professional execution model mandates treating it as a satellite allocation, scaling exposure via disciplined limit orders, and systematically verifying your thesis against hard operational data.
⚠️ Professional Risk Disclaimer
The technical, tokenomic, and macro-financial evaluations compiled within this document are structured exclusively for educational, academic, and research purposes and under no circumstances constitute formal financial, legal, tax, or professional investment advice. The digital asset markets are defined by extreme price volatility. GRT, as a mid-cap infrastructure asset, is capable of printing aggressive vertical runs during narrative expansions and undergoing deep, severe capital drawdowns during market contractions.
Prior to committing capital to The Graph network, you must establish clear answers to three risk parameters: Do you fundamentally understand the structural mechanics of the data indexing sector? Do you fully accept the multi-year emission realities embedded within its inflationary tokenomics framework? Are you financially insulated enough to comfortably withstand a deep correction or total loss of your principal capital?
Never assume an asset is guaranteed to return to past historical peaks simply because it traded at those levels during prior market cycles. An all-time high reflects what the market was irrationally willing to pay during a peak global liquidity event; it does not represent an asset's permanent fair value. Similarly, a low nominal unit price does not mean an asset is cheap. To determine structural valuation, you must calculate circulating market caps, fully diluted valuations, vesting emission schedules, active network node concentrations, on-chain fee generations, and net consumer query demands—never make investment decisions based on a standalone price chart.
The only professional method for navigating alternative assets is initializing micro tracking positions and continuously auditing network health via platforms like The Graph Explorer, Token Terminal, Dune Analytics, CoinMarketCap, and official protocol updates. Short-term price action is noise; organic query volume expansion and structural token value capture represent the definitive signal.
About the Author
Author: Lucas | Web3 SEO & Crypto Research
Lucas is a veteran digital asset analyst specializing in blockchain economics, exchange market structures, Web3 growth engineering, and technical Google SEO traffic optimization. His ongoing research initiatives track quantitative crypto asset price modeling, exchange scaling architectures, deep on-chain transaction forensics, Layer-1/Layer-2 network dynamics, public chain competitive matrices, tokenized RWA frameworks, DeFi cash flow structures, and institutional-grade ZK/AI integrations.
When publishing research, Lucas rejects superficial price forecasting in favor of constructing rigorous, multi-variable logical frameworks. He specializes in breaking down the long-term economic value of cryptographic assets by cross-referencing core network fundamentals, macro liquidity cycles, developer retention metrics, geopolitical regulatory developments, and market participant psychology. His structural analysis of The Graph protocol and price projections for 2026–2030 are built exclusively to assist readers in engineering clear, independent analytical frameworks, rather than relying on automated target figures to execute market trades.